
Your schedule has 2 different modes for visualizing activities, each tailored to specific needs on visualizing, editing, and reporting.
Gantt View
Whenever you open a project and toggle on the schedule pane, by default it will be loaded in the Gantt Chart view in which you’ll be able to see all your activities on the left-hand side of the schedule pane and its corresponding Gantt Chart on the right-hand side. This includes visualization of relationships of tasks, as well as their duration bars, and a highlighted critical path:
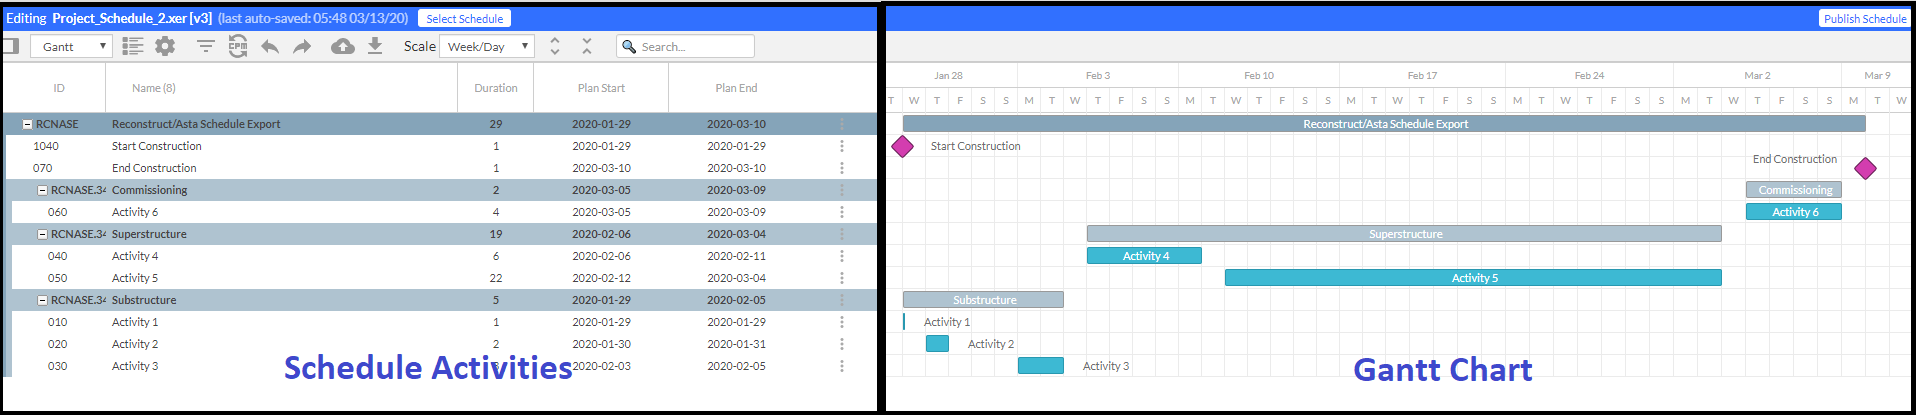
For more detailed information on how to use the Gantt Chart, see The Gantt Chart section.
Progress View
To move to our Progress based view, click on the drop-down located on the upper left corner of the schedule pane. The Progress view shows you the activities for a specific date or a range of dates (according to your Plan Dates) in a tabular format, allowing you to input Progress, Crew size, Hours worked or report any Root Cause for delays on that specific date for a selected activity:
You can filter for which date or range of dates you want to see activities being displayed by using the dropdown filters located on the upper side of the schedule panel. Additionally, you can filter activities by their assigned organization or subcontractor. For more information on how to assign an Organization to an activity, see Editing & Publishing Schedules section.
Note, you can only make modifications to the progress information while in Edit mode. For more information on how to access edit mode, see Editing & Publishing Schedules section
Any information reported here is connected in real-time with the reports made through the Reporter App. For more detailed information on how to make report progress using the Reporter App
Comments
0 comments
Please sign in to leave a comment.